|
More Information: |
|
Impacts of Hurricane Katrina on MS and LA Coastal Structures
|
|
In addition to its massive physical impacts, Hurricane Katrina
engendered many disputes between policy holders and insurance
companies over the agent and timing of damages to covered structures
– what became known as the “wind vs. flood” question. EOE has helped
resolve dozens of these cases by providing state of the art, site
specific hindcasts of the storm conditions. By using a suite of
numerical models, a detailed (15-minute time step) history was
developed for each property including surge levels, currents, winds,
and waves. These inputs were used to develop the hydraulic and wind
loads on the building and the responses of the actual structural
members, objectively establishing the failure cause, mode, and time.
|
|
|
|
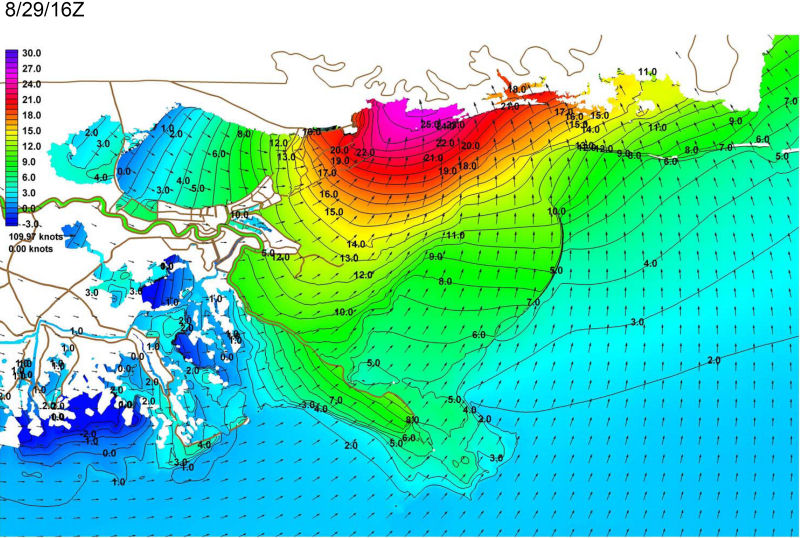
Example surge elevation contour plot of the MS LA coast as Katrina makes its second landfall, from the ADCIRC model run (IPET, 2006)
|
|
Time history of wind speed and surge level at a residence in Bay St
Louis as Hurricane Katrina came ashore. The winds peaked at 115 mph
at 10:00, and the surge reached nearly 25 ft one hour later. The top
and bottom elevation of one wall is
|
|
Time history of wind and flood forces on one wall of a residence in Bay St Louis as Hurricane Katrina came ashore. Note that the wind force decreases as the wall is flooded. This wall failed by 8:00 when the force exceeded the capacity.
|
|
|